
Jesus M. Fernandez, REALTOR® 786-553-7530
Morris Williams Realty: 888-326-3949


There is no town like my hometown! I have it all here!
MIAMI LAKES MARKET REPORT

"An investment in knowledge pays the best interest."
-Benjamin Franklin
Welcome to the September Miami Lakes Market Report, where we review February's results. We’re excited to share the latest real estate trends, including sales, active listings, months of inventory, average days on market, and the difference between original listing and final sale prices. Unlike reports from platforms like Zillow or Redfin, our data is comprehensive, sourced from verified transactions rather than AI-generated estimates or geographic area data. Our reports are exclusive to Miami Lakes and take approximately five weeks to compile. Explore our insights to make informed decisions when buying or selling your Miami Lakes home. Contact us today—we’re your local experts!
Single Family Homes

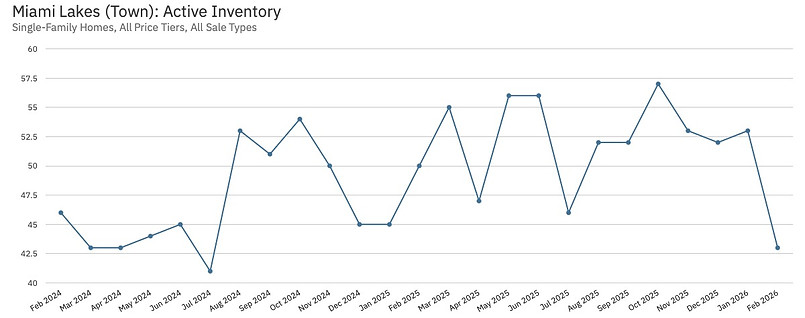
Active Inventory refers to the number of single-family residences available for purchase. A higher number of properties typically favors buyers, while fewer properties favor sellers.
Active inventory of single-family homes in Miami Lakes showed moderate seasonal fluctuations with no strong long-term upward or downward trend from February 2024 to February 2026.
Levels generally oscillated between ~41–58 homes, with noticeable peaks around mid-summer to early fall (Aug–Oct) in both 2024 and 2025, and lows frequently appearing in late winter/early spring (Feb–Apr) and occasionally mid-year.
The most recent reading (Feb 2026) sits at the lower end of the historical range at ~42–43 homes, suggesting relatively tight supply compared to the peaks seen in the previous two years. Overall, inventory remains relatively stable with typical seasonal patterns rather than dramatic expansion or contraction.

The months of inventory metric indicates the time required to sell all currently listed properties based on recent sales trends. A lower number of months signals a seller's market, while a higher number suggests slower sales, potentially favoring buyers.
From February 2024 to February 2026, months of supply for single-family homes in Miami Lakes fluctuated between roughly 3.9 and 5.8 months, showing distinct seasonal patterns but no clear multi-year upward or downward trend.
Peaks typically occurred in late summer to fall (Aug–Nov), with the highest readings around 5.5–5.8 months in both 2024 and 2025.
Lows frequently appeared in late winter/early spring (Feb–Apr) and mid-summer (Jul–Aug in some cycles), dipping as low as ~3.9–4.2 months.
The most recent point (Feb 2026) sits at approximately 4.1 months — near the lower end of the observed range.
Current implication (March 2026): A months-supply level around 4.0–4.2 indicates a relatively balanced-to-seller-leaning market in this segment — tighter than the seasonal highs of the past two years, consistent with stable (not rapidly cooling or flooding) inventory conditions for single-family homes in Miami Lakes.

The Closed Sales metric tracks when most sales occur within a 12-month period. Historically, the highest sales volume occurs during the summer months or just before the new school year starts.
From February 2024 to February 2026, monthly closed sales of single-family homes in Miami Lakes showed clear seasonal patterns with significant month-to-month volatility, ranging from a low of ~4–5 sales to a high of 21 sales.
Strongest periods typically occurred in summer months (especially July–August), with notable peaks in Jul 2024 (~18), Aug 2025 (~21 — the highest in the period), and several other mid-year months exceeding 15 closings.
Weakest periods consistently appeared in late fall through winter (Nov–Feb), frequently dropping to 5–7 sales or lower (e.g., Jan/Feb 2025 ~4–6, Jan/Feb 2026 ~5–6).
Overall volume remained relatively stable year-over-year with no dramatic long-term increase or collapse — 2025 showed a higher seasonal peak than 2024, but winter lows stayed comparably soft.
Current implication (March 2026): February 2026 closed sales (~5–6) sit at the lower end of the historical range, consistent with the typical winter slowdown in this market. Activity is following expected seasonal rhythms rather than signaling a broader cooling trend in single-family home sales volume.

The Average Sale Price Metric represents the average price of homes sold in a given month. This value can vary significantly from month to month, influenced by the number of homes sold.
From February 2024 to February 2026, average sale prices of single-family homes in Miami Lakes fluctuated between roughly $870K and $1.15M, showing pronounced seasonal volatility but no sustained multi-year upward or downward trend.
Highest peaks occurred in summer months: notable spikes in Jun 2024 (~$1.09M), Dec 2024 (~$1.08M), and especially Jul 2025 (~$1.15M — the period high).
Lowest points typically appeared in winter/early spring: Jan–Feb 2025 (~$870K–$900K), May–Jun 2025 (~$870K–$880K), and most recently Feb 2026 (~$905K).
Year-over-year comparison shows similar seasonal amplitude in both 2024 and 2025, with 2025 featuring one higher summer peak but equally deep winter/early-year dips.
Current implication (March 2026): The February 2026 average (~$905K) is near the lower end of the observed two-year range, consistent with the typical winter softening in sale prices. Overall, pricing exhibits classic seasonal cycling (stronger summer, softer winter) around a relatively stable long-term level rather than clear appreciation or depreciation in this single-family segment.

The Median Percent of Original List Price metric compares the original listed price of a property to its final closing price. In a strong seller's market, properties typically sell at or above the original listed price.
From February 2024 to February 2026, the median sale-to-original-list-price ratio in Miami Lakes fluctuated between roughly 89% and 98%, reflecting moderate to significant negotiation pressure with no clear long-term upward or downward trend.
Key observations:
Highest ratios (strongest seller leverage / least discounting) typically occurred in late fall to early winter periods — e.g., Nov–Dec 2024 (~97–98%), Nov–Dec 2025 (~94–95%), and especially Jan–Feb 2026 (peaking near 98% in Jan before dropping).
Lowest ratios (heaviest discounting / buyer leverage) consistently appeared in late winter to mid-summer — most notably Feb 2025 (~90%), Jun–Jul 2025 (~90–91%), and the period low in Feb 2026 (~89–90%).
Overall, 2025 showed slightly deeper average discounting than 2024 (more months in the low 90s), but seasonal cycling remained the dominant pattern.
Current implication (March 2026): The February 2026 reading (~89–90%) marks one of the lowest points in the two-year period, indicating stronger buyer negotiating power at the moment — homes are closing with noticeably larger concessions off original list price compared to seasonal peaks. This aligns with the typical late-winter softening seen in other Miami Lakes metrics (lower inventory, fewer sales, softer average prices).

The Median Time to Contract metric measures the average of the typical time properties take to go under contract after being listed for sale, covering all price tiers and sale types. Properties priced above market value often take longer to go under contract.
From February 2024 to February 2026, median days on market (time to contract) for single-family homes in Miami Lakes ranged from a low of ~20–30 days to a high of ~85–90 days, displaying strong seasonal swings but no evident multi-year lengthening or shortening trend.
Fastest markets (shortest time to contract) typically occurred in spring/early summer — most notably Apr–May 2025 (~25–30 days), Jul–Aug periods in both years (~25–35 days), and especially Jan–Feb 2026 (period low ~20–25 days in Feb).
Slowest markets (longest time to contract) appeared in late winter/early spring and parts of fall — peaks around Feb 2025 (~82 days), Aug–Sep 2025 (~85–90 days), and several other mid-80s readings.
The pattern shows clear seasonality: quicker sales in warmer/peak buying months, slower movement during cooler/off-peak periods.
Current implication (March 2026): February 2026's median (~20–25 days) is among the fastest in the entire two-year period, signaling very strong buyer demand / quick absorption right now — contrasting with the typical late-winter slowdown and aligning with other recent metrics showing tighter inventory and softer pricing concessions in this single-family segment.

The Median Time to Sale metric measures the averagel time properties take to go from contract to closing after being listed for sale, covering all price tiers and sale types. Extended closing times after a property goes under contract may result from canceled sales due to factors such as low appraisals, defects identified during buyer inspections that required remediation, or buyers' inability to secure financing by the contracted day to close.
From February 2024 to February 2026, median time to sale (from list to close) for single-family homes in Miami Lakes ranged from ~50–55 days to ~130 days, showing strong seasonal variation without a clear multi-year trend toward faster or slower sales.
Fastest closings typically occurred in spring/early summer — lowest points in Apr–May 2025 (~50–55 days), Mar–Apr 2025, and Feb 2026 (~60 days).
Slowest closings appeared in late fall through winter — peaks around Jan–Feb 2025 (~125–130 days), Nov–Dec periods, and several other high-110s to low-130s readings.
The pattern mirrors classic real estate seasonality: quicker sales during peak buying season, noticeably longer market times during the off-season.
Current implication (March 2026): February 2026’s median (~60 days) is among the faster readings in the two-year history — indicating relatively brisk closings right now despite the late-winter period. Combined with recent quick time-to-contract (~20–25 days in Feb), this suggests strong
Townhouses / Condos
Miami Lakes is a primarily single-family dominant town, which has a smaller condo segment compared to its single-family homes, and specific condo-only data is limited and compiled using Florida Association of Realtors Sun Stats Reports
Overall Trend-
Overall town housing trends show a balanced-to-softening market in early 2026, with broader South Florida/Miami-Dade condo dynamics providing context — condos generally face more pressure than single-family properties.
Key Observations (Town-Level & Regional Context):
Condos in the broader area show higher inventory (often 11–14+ months supply vs. ~4–6 months for single-family), softer median prices (e.g., Miami-Dade ~$420K holding steady but with sales flat/slightly down), and a buyer's market vibe due to elevated supply, insurance/HOA challenges, and post-Surfside lending restrictions limiting some buildings. Sales dipped in parts of 2025 but showed late-year stabilization or modest rebounds with easing rates; early 2026 remains mixed/slow.
Miami Lakes Trend- Condos are following a softer trajectory — higher relative inventory, longer market times, and more negotiation room — mirroring regional condo weakness (e.g., statewide condo inventory ~8.8 months at 2025 end vs. 4.6 for single-family).
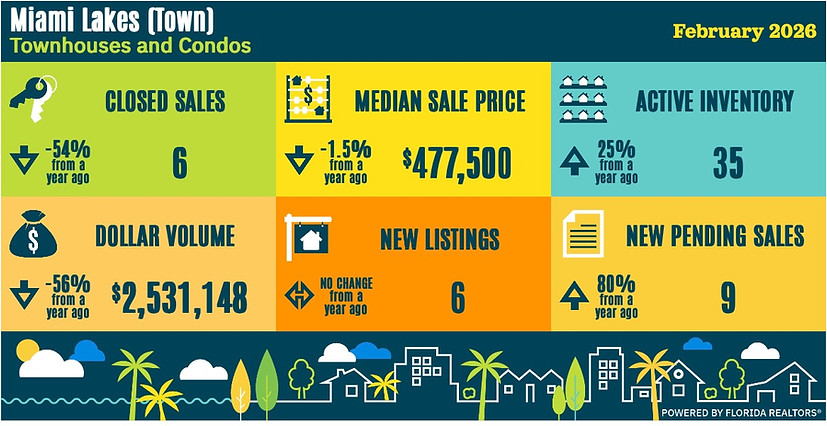
Short summary – Miami Lakes (Town): Townhouses and Condos – February 2026
In February 2026, the townhouses and condos segment in Miami Lakes showed significantly softer activity compared to a year ago, with very low volume in a small market niche.
Closed sales: Only 6 (down sharply -54% YoY), reflecting limited transaction pace.
Median sale price: $477,500 (down modestly -1.5% YoY), holding relatively stable despite low volume.
Active inventory: 35 listings (up +25% YoY), indicating growing supply.
Dollar volume: $2.53M (down -56% YoY), driven by fewer sales.
New listings: 6 (unchanged YoY).
New pending sales: 9 (up strongly +80% YoY), suggesting some pickup in buyer interest/momentum heading into spring.
Current implication (March 2026): This condo/townhouse segment remains buyer-leaning with elevated inventory relative to very low closed sales, more options available, and potential for negotiation. The sharp YoY drop in closings contrasts with steadier single-family trends in Miami Lakes and broader regional condo stabilization (e.g., statewide condo-townhouse sales up +8.6% YoY per Florida Realtors). Low volume makes month-to-month swings volatile, but rising pending sales hint at possible modest recovery as rates and seasonal demand shift. Overall, condos/townhomes lag single-family homes here, consistent with South Florida patterns where attached properties face more supply pressure.
We know Miami lakes real estate like no one else!

You and your family, will be in very good hands!
Jesus M. Fernandez
REALTOR® & Website Publisher
American Dream Maker, since 1995